




When Bitcoin derivatives data flashes a warning, many traders reach for a single indicator: a bright liquidation cluster, a jump in open interest, or an extreme funding print. Each tells only part of the story. In a CoinGlass BTC futures data snapshot taken on September 16, 2026, BTC traded near $75,871, with roughly $52.16 billion in aggregate open interest, $88.51 billion in 24-hour futures volume, and about $223.8 million in 24-hour BTC futures liquidations.
Quick answer
A liquidation heatmap shows where estimated forced closures may concentrate. Open interest shows how much derivatives positioning remains open. Funding rates show which side of perpetual futures is paying the other, and how one-sided perpetual pricing has become. None of the three reliably predicts BTC direction on its own. Their value lies in combining location, leverage buildup, and positioning bias into a repeatable risk checklist rather than a price-prediction system.
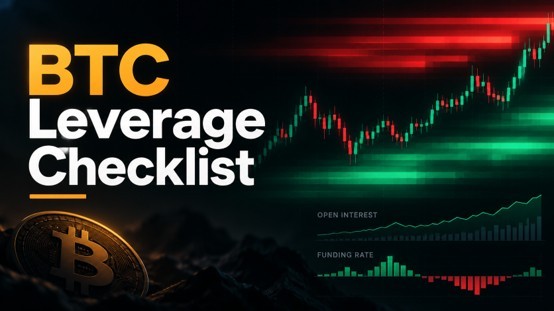
Liquidation Heatmap vs Open Interest vs Funding Rate: What Does Each Indicator Actually Tell You?
BTC Liquidation Heatmap — Where Forced Closures May Cluster
A BTC liquidation heatmap estimates where leveraged positions could be forcibly closed at different price levels, using market and leverage data. Brighter zones indicate a greater relative concentration of estimated liquidations rather than confirmed volume. A heatmap is a model: it is not an order book, and a highlighted zone is not a price target. CoinGlass itself notes that actual liquidation amounts may differ from its estimates.
Open Interest — How Much Leverage Remains in the Market
Open interest (OI) counts active derivatives contracts that have not been closed or settled. Rising OI means positions are being added; falling OI means they are being removed. Because every contract has both a long and a short side, OI alone cannot tell you whether new leverage leans bullish or bearish.
Funding Rate — Which Side of Perpetuals Is Paying
Perpetual futures have no expiry, so periodic funding payments help keep their price anchored toward spot. When funding is positive, longs generally pay shorts; when it is negative, shorts generally pay longs. Persistent readings reveal a premium or discount in perpetual pricing, which often reflects positioning pressure.
Venues differ in formulas and settlement intervals, so always note the unit. Many exchanges settle every eight hours, meaning a 0.01% per-interval rate equals roughly 0.03% daily or about 10.95% annualized, while others settle hourly or every four hours. Compare normalized daily or annualized figures, and judge whether funding is "extreme" relative to that venue's own history, such as its top or bottom range over the past 90 days, rather than by a fixed number.
How Should Traders Combine Heatmaps, OI, and Funding Instead of Reading Them Separately?
Step 1 — Start With Price and the Liquidation Map
Identify significant clusters above and below the current BTC price, then measure the distance to each. The largest color block deserves attention, not an assumption that price will reach it. Switch between time ranges to separate nearby intraday clusters from larger multi-day structural zones.
Step 2 — Check Whether OI Is Expanding or Unwinding
Read OI alongside price:
- Price up + OI up: leveraged participation is increasing as price rises; use funding and other data to assess the directional bias.
- Price down + OI up: open positioning is expanding as price falls; funding and order-flow context are needed to judge which side is driving it.
- Large price move + OI down: position closures or deleveraging may be driving the move, though falling OI alone cannot confirm that liquidations were the cause.
- Sideways price + rapidly rising OI: leverage is accumulating without resolution; watch for volatility expansion.
Treat these as diagnostic patterns that frame questions, not as trade triggers.
Step 3 — Use Funding to Identify the Crowded Side
Strongly positive funding with rising OI means downside long-liquidation clusters deserve closer attention. Strongly negative funding with rising OI shifts the focus to upside short-liquidation zones. Neutral funding with rising OI suggests increasing leverage without an obvious one-sided perpetual-price bias, so avoid forcing a squeeze narrative.
Aggregate CoinGlass OI and funding data are useful for reading overall market context, but the exchange and contract you actually trade may look different, so check venue-specific figures before acting.
The working framework: heatmap = location → OI = leverage intensity → funding = positioning bias. It is a way to organize risk analysis, not a formula that outputs a direction.
Which Signal Combinations Suggest a BTC Liquidation Cascade or Squeeze Risk?
Why Rising OI Matters More When Funding Is Already Extreme
Extreme funding with flat OI may simply reflect an imbalance that has been in place for some time. Extreme funding combined with rapidly rising OI is different: it shows leveraged participation is expanding while perpetual pricing remains strongly one-sided, increasing sensitivity to an unwind.
Why a Liquidation Event Can Change the Signal
If BTC trades through a cluster while OI collapses, much of the leverage may already be gone, and the pre-move data no longer describes the market. The next cluster on the map will not necessarily produce a second cascade. After a squeeze, rebuild the setup using fresh OI and funding readings.
Read more: Is Bitcoin And Cryptocurrency The Future of Money?
How to Build a Leverage-Aware BTC Trading Checklist Before Entering a Position
Pre-Trade BTC Leverage Checklist
- Price context: Trend, range, support and resistance, recent volatility. Derivatives metrics should never override basic market structure.
- Liquidation location: Where are meaningful clusters relative to your entry, and does your planned stop or liquidation price sit inside a dense zone?
- OI trend: Is leverage increasing, stable, or being flushed? Judge the change against price rather than absolute OI.
- Funding direction and magnitude: Is normalized funding positive, negative, or neutral, and is it moving toward the edges of its historical range?
- Signal alignment: Do OI and funding reinforce the heatmap risk, or contradict it?
- Trade invalidation: Define where the thesis is wrong before entering.
- Position sizing: Reduce leverage when nearby liquidation clusters, rapidly rising OI, and extreme funding coincide.
- Event risk: Check major macro releases, ETF-related flows, regulatory announcements, and other catalysts capable of overwhelming derivatives positioning.
Decision rule: More leverage signals aligning should mean greater caution, not greater confidence in taking on more leverage.
What Are the Most Common Mistakes When Reading BTC Derivatives Data?
Treating Heatmap Clusters as Guaranteed Price Targets. Liquidation concentrations can amplify volatility when price reaches them, but BTC is under no obligation to go there.
Assuming High OI Means a Crash Is Coming. Large OI can coexist with a healthy market. What matters is how OI changes relative to price and funding.
Reflexively Fading Extreme Funding. Crowded positioning can stay crowded far longer than a contrarian expects. Deeply positive funding is not a ready-made short entry, and deeply negative funding is not a ready-made long.
Mixing Data From Different Exchanges Without Normalization. Funding formulas, settlement intervals, mark and index-price methods, and liquidity all vary by venue, so raw rates are rarely comparable one-to-one. Use aggregated data for context and venue-specific data for the contract you actually trade.
<span style="font-size: 17pt; font-family: Calibri,sans-serif; color: #000000; background-color: transparent; font-weight: bold; font-style: normal; font-variant: normal; text-decoration: none; vertical-align: baseline; white-space:

What's your reaction?
You may also like
-

What Is the Best White Label VoIP Reseller Program for UK Businesses?
-
What Makes the Best Middle Schools in Colorado Stand Out?
-
Why Picking the Right Ring Makes All the Difference
-
5 Tips for Dressing with Confidence
-
7 Ways Latest News and Trends Shape Everyday Decisions
-
The Reveal Is the Story: Building Curiosity into AI Video














Comments
0 comment